<< Previous section: Graphs | Main Table of Contents | Next section: Mathematics >>
Table of Contents for Section F
F. Maps
Maps
1. Geographic Maps
© Harcourt School Publishers 2008
Guidelines:
- Maps may be decorative, or simple locator maps, and may only require a short description. See Description 1.
- If the map is used to illustrate a concept and help define new terms, describe the lines of latitude and longitude and explain how they look on the map (horizontal, vertical), and the corresponding degrees. See Description 2.
- If the map is used as part of a geography lesson and the land and water are relevant, describe the labeled areas, including their relationship and distance to each other when relevant. See Description 3.
Description 1:
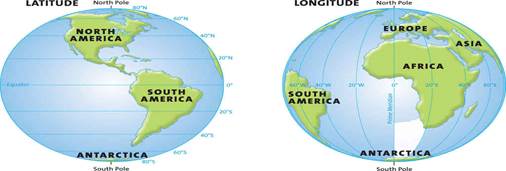
Two global maps highlight lines of latitude and longitude.Description 2:
Two global maps are shown side by side. One global map highlights lines of latitude. These lines are horizontal and are labeled zero degrees at the Equator in the middle of the globe. From the Equator, the lines go from 20 degrees to 80 degrees in both directions, to the North and South poles. The other global map highlights lines of longitude. These lines are vertical and are labeled zero degrees at the Prime Meridian in the middle of the globe. From the Prime Meridian, the lines go from 20 degrees to 80 degrees, east and west.Description 3:
Two global maps are shown side by side. One global map highlights lines of latitude. These lines are horizontal and are labeled zero degrees at the Equator in the middle of the globe. From the Equator, the lines go from 20 degrees to 80 degrees in both directions, to the North and South poles. North America, South America, and a portion of Antarctica are shown. The other global map highlights lines of longitude. These lines are vertical and are labeled zero degrees at the Prime Meridian in the middle of the globe. From the Prime Meridian, the lines go from 20 degrees to 80 degrees east and west. Africa, Europe, and portions of Asia, Antarctica, and South America are shown.This image in context:
- This image appears at the end of the section.
- In this context, only the lines of latitude and longitude are being reviewed, therefore, the continents, oceans, and hemispheres are not pertinent.
- In context, Description 2 is the best fit.
Return to main table of contents | Return to top of page | Next
2. Political Maps
© Harcourt School Publishers 2008
Guidelines:
- Focus on the map’s central teaching point to determine if borders, region shapes, and bodies of water are important.
- If the map is an essential part of the lesson or assessment, provide a general overview along with details and place names. Include labeled landmarks and labeled bodies of water in the description. If there are too many labels (if all 50 states are labeled on a map of the U.S., for example), focus on the labels that are most relevant to the figure and the concept it is depicting. Whenever possible, organize the description using bulleted lists and by pulling the most important information to the beginning of the description so students hear it first. See Description 1.
- If the map is supporting surrounding text, or if it has a detailed caption, describe general trends in the map and refer to large areas at once. See Description 2.
- The elements in the key can be folded in to the description of the map itself and do not need to be described separately.
Description 1:
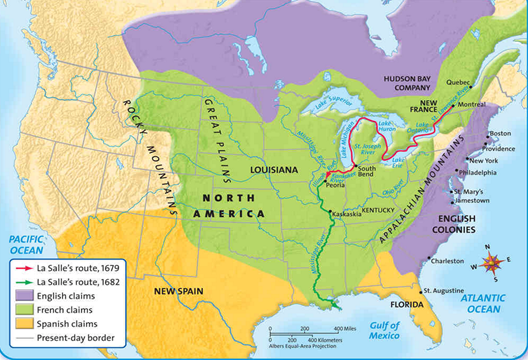
A map of North America with present day borders shows European claims in 1682. Two different, mostly water-routes are marked to show La Salle’s route in 1679 and 1682. La Salle’s route in 1679 starts in Montreal and goes south, through Lake Ontario and Lake Erie, and then loops north, around Michigan, ending in Peoria, Illinois. La Salle’s route in 1682 starts in Peoria and goes south, along the Mississippi River and the Kentucky and Illinois border. Large swaths of color show English, French, and Spanish claims.- The English claims area is almost the entire East coast, including several major cities like New York and Philadelphia. The English claims area goes from southern Maine to just north of Florida. The area extends from the coast in toward the Appalachian Mountains. Another English claims area covers much of Southern Canada, with a dip into Minnesota and North Dakota.
- The French claims area is most of the Midwest and some of the South, including Kentucky and Louisiana. It goes from north of Quebec, to Louisiana in the south, and Idaho in the west.
- The Spanish claims area is all of Florida and the southern parts of Georgia and Alabama. Another Spanish claims area is most of Texas, New Mexico, and Arizona, with a small portion in Southern California, and most of Northern Mexico.
- The rest of the present-United States, mostly the northwestern states, is not claimed.
Description 2:
A map of North America shows the regions claimed by the English, the French, and the Spanish during the early days of colonization. The area that would become the state of Kentucky was claimed by the French. Arrows also indicate La Salle’s 1679 and 1682 routes of exploration.This image in context:
- The map is part of a lesson on colonization.
- There is a very brief caption that does not go into any detail, but does ask students what year La Salle traveled near Kentucky. Therefore, Description 1 is a good fit.
<< Previous: Section E (Graphs) |Return to main table of contents | Return to top of page | Next: Section G (Mathematics) >>