<< Previous section: Chemistry | Main Table of Contents |Next section: Diagrams (Relational) >>
Table of Contents for Section C
C. Diagrams: Illustrated
1. Simple Diagrams Comparing Objects
2. Complex Diagrams Comparing Objects
3. Diagrams Comparing events over Time
Diagrams: Illustrated
1. Simple Diagrams Comparing Objects
© NCAM 2009
Guidelines:
- Traditional descriptions of purely visual images benefit from descriptions that are brief and specific.
- Organize the description in a linear fashion, in this case, moving left to right and use bullet points or line breaks to aid in navigation.
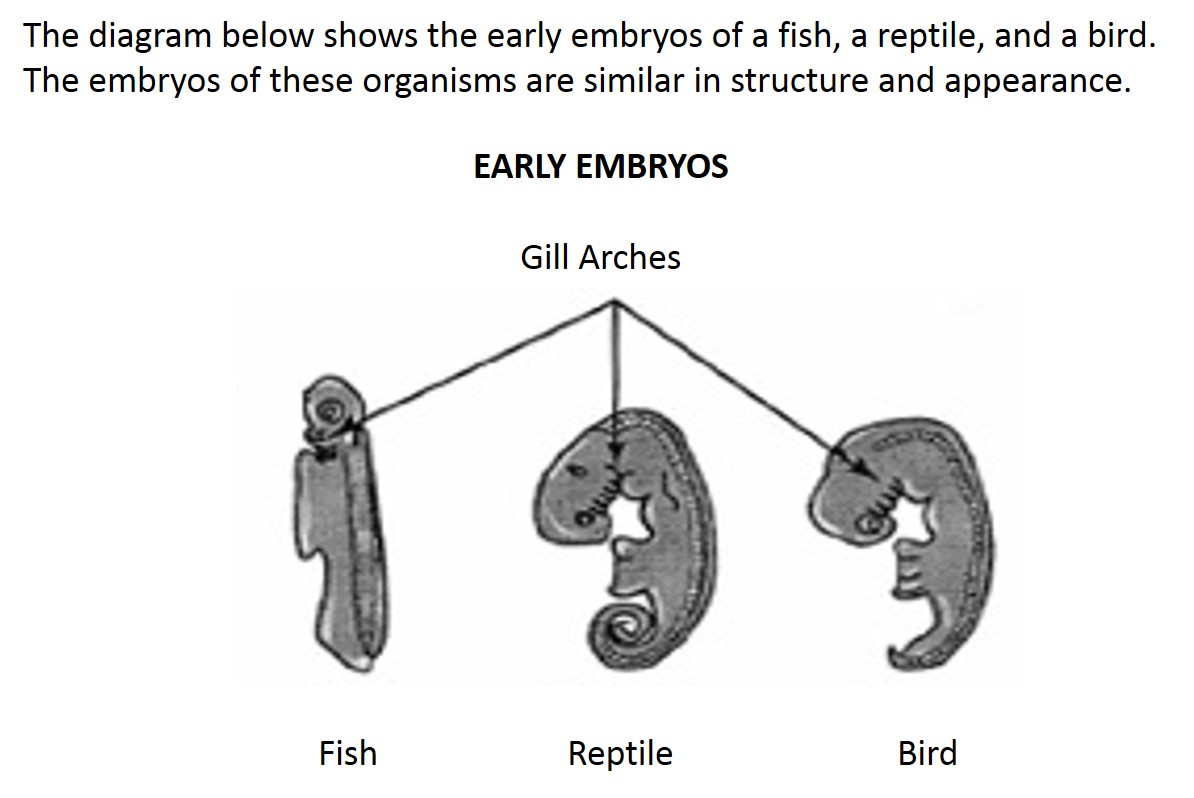
- Focus on the intent of the image and the surrounding text. In this case, the illustration compares the similarities and differences of three embryos.
Description:
Note that all three embryo illustrations are shown in side view. The fish embryo is long, narrow and straight. Its head is small, round, and contains gill arches. A large flap extends to the left, from just below the head to the middle of the embryo. A segmented bony structure runs the length of the embryo on the right. The reptile embryo is much longer and fatter than the fish embryo, but is curled into a fetal position. Its head is bent forward and is twice as large as that of the fish embryo. The reptile embryo has twice as many gill arches as the fish embryo, but the flap on the left side is only half as long. A segmented bony structure runs the length of the embryo on the right. The bird embryo is curved more than the fish embryo, but is not as long or as curved as the reptile embryo. The head of the bird embryo is almost as large as the reptile embryo, but has fewer gill arches. A flap the same size as that of the reptile embryo extends to the left. A segmented bony structure runs the length of the embryo on the right. Arrows point to the gill arches of all three embryos.Return to main table of contents | Return to top of page | Next
2. Complex Diagrams Comparing Objects
© Pearson Education 2009
Guidelines:
- The various relationships between the finches can be replicated in a table.
- This is a case in which the table requires more work to discern the relationships than the illustration does. A b/vi person would have to review the table several times to establish the patterns that a sighted person sees almost instantly. However, the table does allow for quick review of data that a narrative-style description would not.
- This table, like all tables, can be rendered differently. In this case, the alternate would be to have the categories run down the left-hand column instead of across the top row.
- If the colors of the finches’ feathers are important, an additional column can be added to the table.
Description:
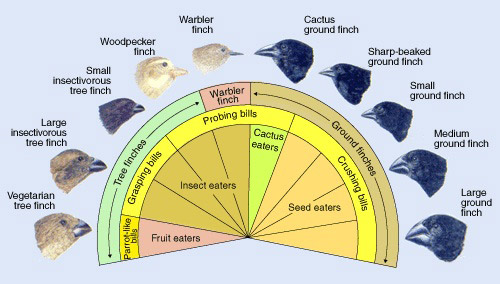
An illustration showing 10 different finches and their variations is depicted in the following table.
Adaptive Radiation: Darwin’s Finches
| Name | Finch | Bill | Food |
|---|---|---|---|
| Vegetarian tree finch | Tree finches | Parrot-like bills | Fruit eaters |
| Large insectivorous tree finch | Tree finches | Grasping bills | Insect eaters |
| Small insectivorous tree finch | Tree finches | Grasping bills | Insect eaters |
| Woodpecker finch | Tree finches | Probing bills | Insect eaters |
| Warbler finch | Warbler finch | Probing bills | Insect eaters |
| Cactus ground finch | Ground finches | Probing bills | Cactus eaters |
| Sharp-beaked ground finch | Ground finches | Crushing bills | Seed eaters |
| Small ground finch | Ground finches | Crushing bills | Seed eaters |
| Medium ground finch | Ground finches | Crushing bills | Seed eaters |
| Large ground finches | Ground finches | Crushing bills | Seed eaters |
Return to main table of contents | Return to top of page | Next
3. Diagrams Comparing Events over Time
© Pearson Education 2009
Guidelines:
- Diagrams with more than three pieces of information could be written in bullet form for easier navigability for the student to obtain specific data.
- Write out abbreviations for clearer pronunciation.
- Spell out large numbers. For example 300,000 as three hundred thousand.
- While this diagram may initially look complicated because it shows colors, arrows, and levels, focusing on the actions taking place, in order, makes it easier to describe.
- If each part of a multi-part image is similar and contains the same types of information with only slight variation, use the same order, sentence structure, and words for the description of each part.
- The description should not attempt to teach the concept. That should be done in the surrounding text.
Description:
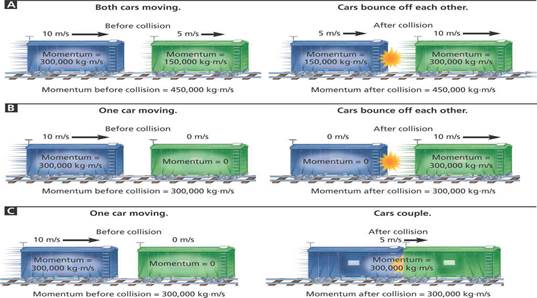
A diagram shows three different collisions between equal-mass train cars.- Collision A, both cars are moving in the same direction. Before the collision, the first car is moving at ten meters per second with a momentum of three hundred thousand kilograms times meters per second. The second car is moving at five meters per second with a momentum of one hundred and fifty thousand kilograms times meters per second. The total momentum before the collision is four hundred fifty thousand kilograms times meters per second. The cars bounce off each other. After the collision, the first car is moving at five meters per second and with a momentum of one hundred and fifty thousand kilograms times meters per second and the second car is moving at a speed of ten meters per second with a momentum of three hundred thousand kilograms times meters per second. The total momentum stays the same after the collision at four hundred fifty thousand kilograms times meters per second.
- Collision B, one car moving. Before the collision, the first car is moving at ten meters per second with a momentum of three hundred thousand kilograms times meters per second. The second car has speed zero meters per second and momentum equals zero. The total momentum before the collision is three hundred thousand kilograms time meters per second. The cars bounce off each other. After the collision, the first car has speed zero meters per second and momentum equals zero. The second car is moving at a speed of ten meters per second with a momentum of three hundred thousand kilograms times meters per second in the direction the first car was originally moving. The total momentum stays the same after the collision at three hundred thousand kilograms times meters per second.
- Collision C, one car moving. Before the collision, the first car is moving at ten meters per second with a momentum of three hundred thousand kilograms times meters per second. The second car has speed zero meters per second and momentum equals zero. The total momentum before the collision is three hundred kilograms times meters per second. The cars couple. After the collision, both cars are moving together at five meters per second with a momentum of three hundred thousand kilograms per second in the direction the first car was originally moving. The total momentum stays the same after the collision at three hundred thousand kilograms times meters per second.
This image in context:
- This image is used at the beginning of the section to introduce the concept.
- The caption below the image summarizes the concept and asks students to calculate the mass of each train car.
<< Previous: Section B (Chemistry) | Return to main table of contents | Return to top of page | Next: Section D (Diagrams: Relational) >>