<< Previous section: Diagrams (Illustrated) | Main Table of Contents | Next section: Graphs >>
Table of Contents for Section D
D. Diagrams: Relational
Diagrams: Relational
1. Venn Diagrams
© NCAM 2009
Guidelines:
- Focus on the data in the Venn diagram, not on its appearance.
- Provide the data in brief statements.
- Give a summary if one is immediately apparent.
- Include the caption only if it is not accessible from elsewhere in the text. In this example, the caption is part of the image file and is therefore only accessible as part of the description.
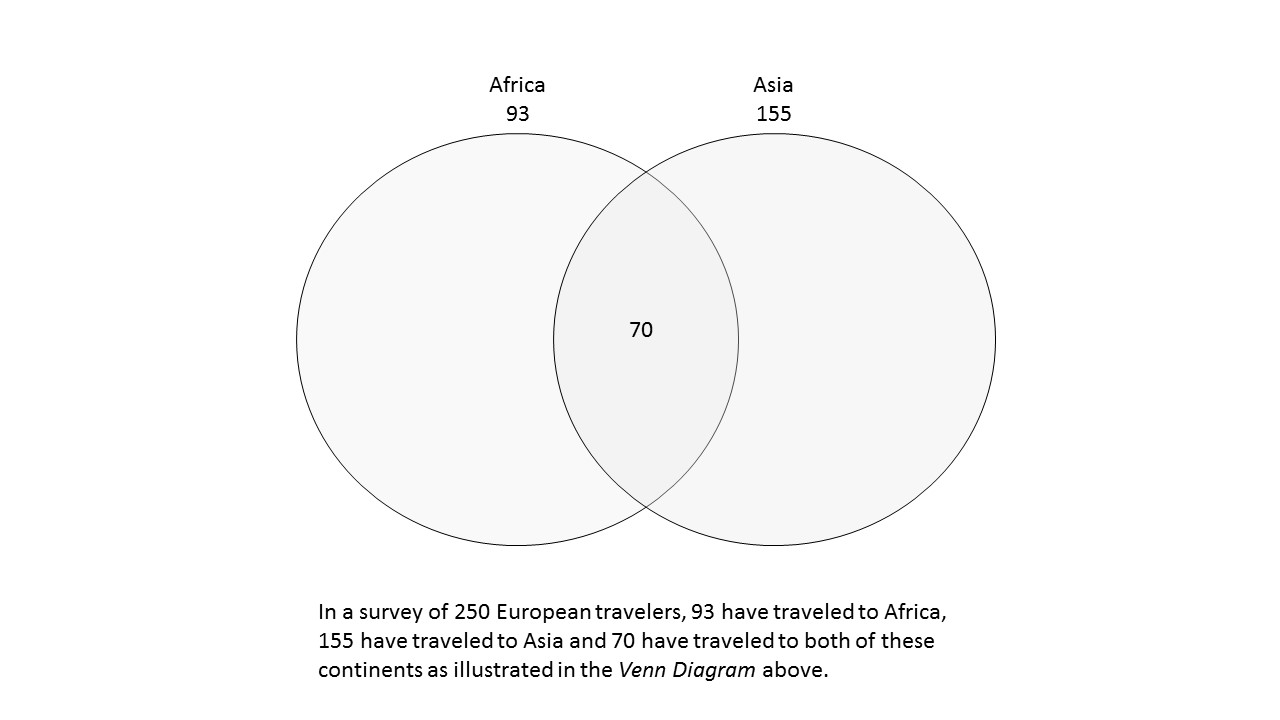
Description:
A Venn diagram captioned: “In a survey of 250 European travelers, 93 have traveled to Africa, 155 have traveled to Asia, and 70 have traveled to both of these continents, as illustrated in the Venn diagram above.” The Venn diagram shows 2 intersecting circles, one labeled Africa 93 and the other labeled Asia 155. The area of intersection is labeled 70.Return to main table of contents | Return to top of page | Next
2. Radial and Web Diagrams
© Pearson Education 2009
Guidelines:
- Identify that the image is a web diagram with a center circle and the number of circles connected/linked to it.
- Identify labels in the circles.
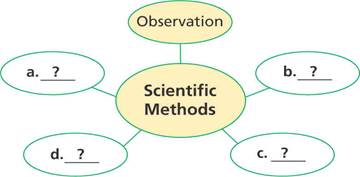
Description:
A web diagram has a center circle and five smaller circles connected to it. The center circle is labeled Scientific Methods. One connected circle is labeled Observation. The other four circles are labeled A, B, C, and D.Return to main table of contents | Return to top of page | Next
Hierarchy and Tree Diagrams
© Pearson Education 2009
Guidelines:
- Set up the diagram by providing the title if there is one and a general overview, including its levels and parts.
- Approach the diagram from top to bottom and from left to right.
- Depending on the grade level, the diagram can be described using a narrative, a simple bulleted list, or a complex nested list.
- Description 1 uses all text. This should be the default approach, especially for lower grade levels.
- Description 2 uses a simple bulleted list. This approach is appropriate for high school grade levels, where students are comfortable navigating bulleted lists with a screen reader.
- Description 3 uses a nested list. This is the most complex approach and should only be used for academic college-level or professional texts.
- Any art or photos included in the diagram should be described if they are the only example of the concepts described in the diagram. For this particular image, the photos are labeled with the names of each level, so there is no need for additional description of the photos.
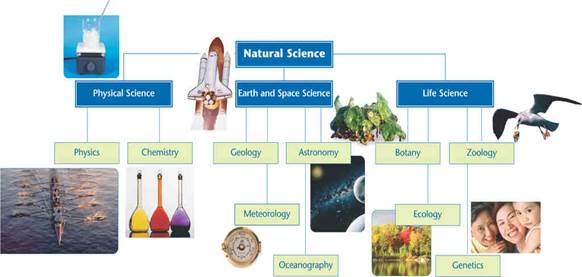
Description 1 (all text for elementary level):
A tree diagram shows different branches of science. There are three levels, from top to bottom. The highest level is Natural Science. The next level has Physical Science, Earth and Space Science, and Life Science. Physical Science includes Physics and Chemistry. Earth and Space Science includes Geology, Meteorology, Astronomy, and Oceanography. Life Science includes Botany, Ecology, Zoology, and Genetics.Description 2 (simple list for high school level):
A tree diagram shows different branches of science. There are three levels, from top to bottom. The highest level is Natural Science. The next level has Physical Science, Earth and Space Science, and Life Science. Physical Science- Physics
- Chemistry
- Geology
- Meteorology
- Astronomy
- Oceanography
- Botany
- Ecology
- Zoology
- Genetics
Description 3 (nested list for college level students and professional texts):
A tree diagram shows different branches of science. There are three levels, from top to bottom.- Natural Science.
- Physical Science.
- Physics and Chemistry.
- Earth and Space Science.
- Geology, Meteorology, Astronomy, and Oceanography.
- Life Science.
- Botany, Ecology, Zoology, and Genetics.
- Physical Science.
This image in context:
- This figure is used as an opening to a new lesson on branches of science. In addition to showing students all of the branches of science and how they are connected, the figure also helps students develop their diagram interpretation skills.
- The figure has a caption, but it is very brief, so a comprehensive description is required. The caption includes a question about changing the diagram to show how the branches can overlap.
- The photos support each branch of science, but are not strongly connected to the central teaching point. The lesson below the figure explains each branch, so photos are not the only means of explanation for students and can be ignored. Since the question asks students to change the diagram to show how the branches overlap, the focus is clearly on the diagram itself and not the photos.
- Since this figure is intended for an elementary school audience, Description 1 is most appropriate.
Return to main table of contents | Return to top of page | Next
Flow Charts
4a. Basic
© NCAM 2009
Guidelines:
- Flow charts are a common method of presenting information and one of the most difficult images to describe.
- Simple flow charts can be converted into nested lists with good results. Present the “boxes” as numbers and the possible transitions as sub-bullets.
- For some people, combining description with a tactile version of a flow chart facilitates comprehension.
- It is not necessary to describe the visual attributes of the charts, e.g. yellow boxes, curved arrows, etc., unless there is an explicit need such as an exam question referring to these attributes.
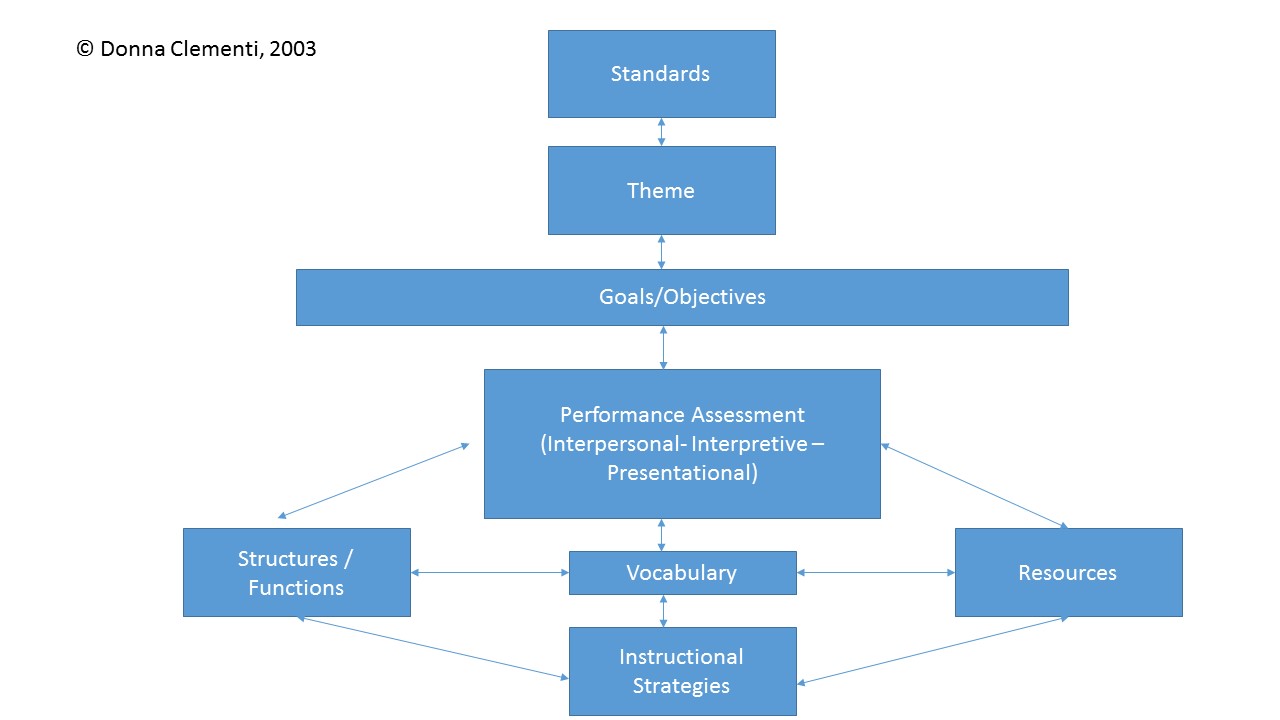
Description:
The figure is a flow chart with eight labeled boxes linked by arrows. The chart is multi-directional. At each step, arrows point forward to one or more boxes and back to the previous box or boxes. Here the flow chart is described as lists in which the possible next steps are listed beneath each box label.- Standards
- forward to Theme
- Theme
- back to Standards
- forward to Goals/Objectives
- Goals/Objectives
- back to Theme
- forward to Performance Assessment
- Performance Assessment (Interpersonal – Interpretive – Presentational)
- back to Goals/Objectives
- forward to Structures/Functions
- forward to Vocabulary
- forward to Resources
- Structures/Functions
- back to Performance Assessment
- lateral to Vocabulary
- forward to Instructional Strategies
- Vocabulary
- back to Performance Assessment
- lateral to Structures/Functions
- lateral to Resources
- forward to Instructional Strategies
- Resources
- back to Performance Assessment
- lateral to Vocabulary
- forward to Instructional Strategies
- Instructional Strategies
- back to Structures/Functions
- back to Vocabulary
- back to Resources
Return to main table of contents | Return to top of page | Next
Multiple Start Points
© NCAM 2009
Guidelines:
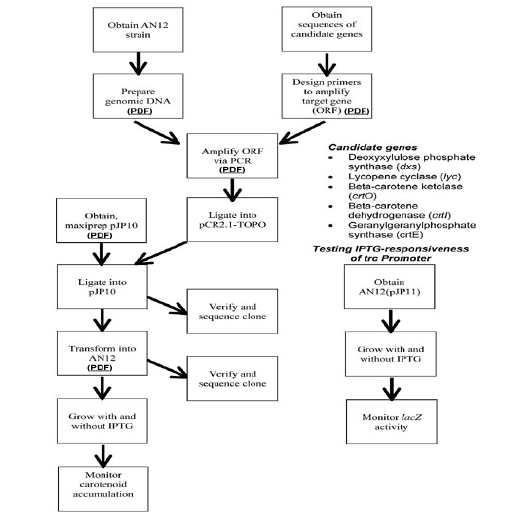
- Visually, a flow chart can convey complex relationships almost instantly. In this example, one can quickly see that the main process can begin in three different ways and that there are two other processes that are closely related but not directly connected.
- Begin with a brief overview, explaining the distinct elements of the image, including if it has multiple starting points, additional lists, etc.
- Describe each section of the flow chart linearly, using nested lists as an organizing tool.
- Combining description with a tactile version of a flow chart may provide increased access.
- It is not necessary to describe the visual attributes of the charts, e.g. yellow boxes, curved arrows, etc., unless there is an explicit need such as an exam question referring to these attributes.
- It may be helpful to explicitly state when the different lines merge.
Description:
Large Flow Chart The large flow chart has three different starting points, presented here as separate lists with numbered steps. When a step has more than one possible next step, they are listed beneath it. Starting point A- Obtain AN12 strain
- Prepare genomic DNA
- Amplify ORF via PCR
- Ligate into pCR2,1-TOPO
- Ligate into pJP10
- Verify and sequence clone
- Transform into AN12
- Transform into AN12
- Verify and sequence clone
- Grow with and without IPTG
- Grow with and without IPTG
- Monitor carotenoid accumulation
- Obtain sequence of candidate genes
- Design primers to amplify target gene (ORF)
- Amplify ORF via PCR
- Ligate into pCR2,1-TOPO
- Ligate into pJP10
- Verify and sequence clone
- Transform into AN12
- Transform into AN12
- Verify and sequence clone
- Grow with and without IPTG
- Grow with and without IPTG
- Monitor carotenoid accumulation
- Obtain maxiprep pJP10
- Ligate into pJP10
- Verify and sequence clone
- Transform into AN12
- Transform into AN12
- Verify and sequence clone
- Grow with and without IPTG
- Grow with and without IPTG
- Monitor carotenoid accumulation
- Obtain AN12 (pJP11)
- Grow with and without IPTG
- Monitor IacZ activity
- Deoxyxylulose phosphate synthase (dxs)
- Lycopene cyclase (lyc)
- Beta-carotene ketolase (crtO)
- Beta-carotene dehydrogrnase (crtl)
- Geranylgeranylphosphate synthase (crtE)
Return to main table of contents | Return to top of page | Next
4.c Multiple Paths
© NCAM 2009
Guidelines:
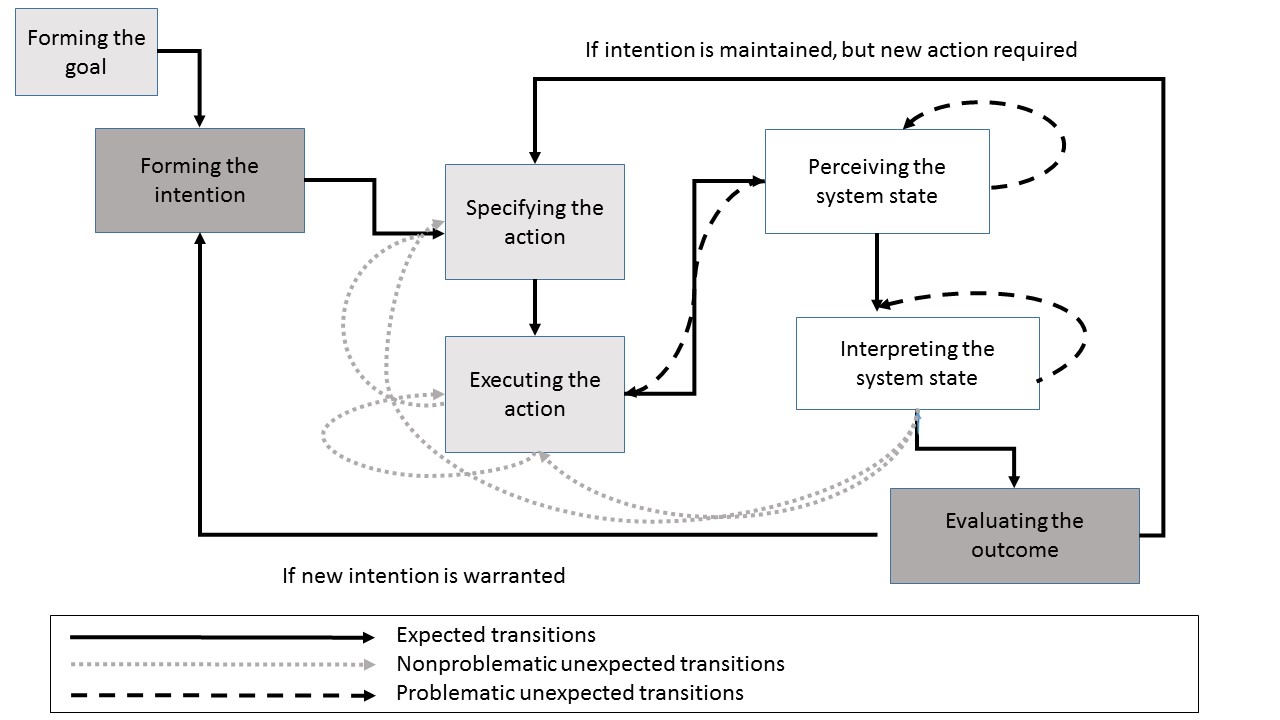
- At first, this flow chart may seem impossible to describe. Even visually, the process it illustrates is not immediately obvious and appears rather complex.
- Convert the flow chart into a single linear list, with the possible next steps of each box or item nested below it.
- A tactile version may add accessibility.
Description:
The figure is a flow chart with 7 stages of action. 3 types of lines represent different transitions between the stages of action. The lines are labeled: Expected transitions, Non-problematic unexpected transitions, and Problematic unexpected transitions. Here the flow chart is described as a nested list in which possible transitions are listed beneath each stage of action.- Forming the goal
- Expected transition to Forming the intention
- Forming the intention
- Expected transition to Specifying the action
- Specifying the action
- Expected transition to Executing the action
- Executing the action
- Expected transition to Perceiving the system state
- Non-problematic unexpected transition to Executing the action
- Non-problematic unexpected transition to Specifying the action
- Perceiving the system state
- Expected transition to Interpreting the system state
- Problematic unexpected transitions to Perceiving the system state
- Problematic unexpected transitions to Executing the action
- Interpreting the system state
- Expected transition to Evaluating the outcome
- Problematic unexpected transition to Interpreting the system state
- Non-problematic unexpected transitions to Executing the action
- Non-problematic unexpected transitions Specifying the action
- Evaluating the outcome
- If intention is maintained, and a new action is required then Expected transition to Specifying the action
- If a new intention is warranted then Expected transition to Forming the intention
Return to main table of contents | Return to top of page | Next
5. Cycles
5a. Basic with Arrows
© Pearson Education 2009
Guidelines:
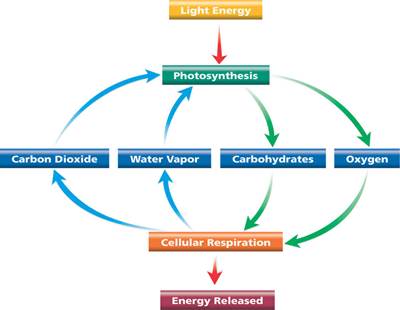
- For diagrams or illustrations with arrows, describe the arrow’s function instead of the arrow itself. Various phrases may be appropriate, such as “leads to,” “points to,” “yields,” “feeds on,” “changes into,” depending on the context.
- Use bulleted lists to organize the steps when individual phases are important. See Descriptions 1 and 2.
- Use a narrative to tell a story when the general concept is more important. See Description 3.
Description 1:
A diagram shows the process of photosynthesis and cellular respiration.- Light Energy leads to photosynthesis.
- Photosynthesis leads to carbohydrates and oxygen.
- Carbohydrates and oxygen leads to cellular respiration.
- Cellular respiration leads energy released, water vapor and carbon dioxide.
- Water vapor and carbon dioxide lead back to photosynthesis, and the cycle continues.
Description 2:
A diagram shows the process of photosynthesis and cellular respiration. The top of the diagram is labeled Light Energy. An arrow points down to Photosynthesis.- From Photosynthesis, two arrows point down to Carbohydrates and Oxygen.
- From Carbohydrates and Oxygen, two arrows point down to Cellular Respiration.
- From Cellular Respiration, one arrow points down to Energy Released.
- From Cellular Respiration, two arrows point up to Carbon Dioxide and Water Vapor.
- From Carbon Dioxide and Water Vapor, two arrows point up to Photosynthesis, and the cycle continues.
Description 3:
A diagram shows the process of photosynthesis and cellular respiration. Light Energy leads to photosynthesis. Photosynthesis leads to carbohydrates and oxygen. Carbohydrates and oxygen leads to cellular respiration Cellular respiration leads to energy released, water vapor and carbon dioxide. Water vapor and carbon dioxide lead back to photosynthesis, and the cycle continues.This image in context:
- This image is introduced after a list of relevant vocabulary and then followed by a fuller explanation of each process.
- The description focuses on what reaction leads to the next reaction.
- In context, Description 1 works best so that students may move from one bullet to the next to listen to the information at their own pace.
Return to main table of contents | Return to top of page | Next
5b. Multiple Cycles
© NCAM 2009
Guidelines:
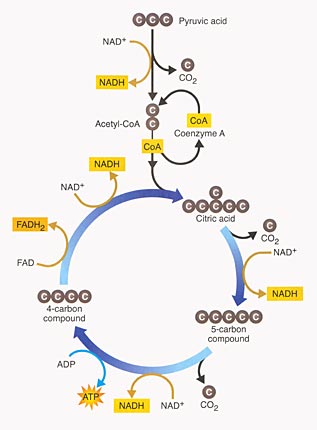
- This illustration shows a process. One way to make this accessible is to lay out the steps in a list, similar to the recommendation for flow charts.
- Again, the illustration itself is colorful and visually interesting but it doesn’t provide additional information beyond the data.
Description:
The Krebs Cycle is depicted as a linear reaction which leads downward into a cyclical reaction. Here, the steps of the reactions are presented as lists.- Linear Reaction
- Pyruvic acid, a 3-carbon compound.
- One carbon molecule is lost as part of a CO2 molecule.
- An NAD-positive molecule enters the reaction, then leaves as NADH.
- A 2-carbon acetyl group remains.
- Coenzyme A, or CoA, joins the 2-carbon acetyl group to form Acetyl CoA.
- CoA leaves the reaction as it delivers the acetyl group to the circular reaction.
- Circular Reaction
- The two-carbon acetyl group joins a four-carbon compound to form a 6-carbon compound, citric acid.
- A carbon is lost as CO2.
- NAD-positive enters, then leaves as NADH.
- A 5-carbon compound remains.
- Another carbon is lost as CO2.
- NAD-positive comes in and leaves as NADH.
- ADP comes in and leaves as ATP.
- A four-carbon compound remains.
- FAD comes in and leaves as FADH2.
- NAD-positive comes in and leaves as NADH.
- Back again at the top of the circular reaction, a two-carbon acetyl group from the linear reaction enters, forming the 6-carbon citric acid at the beginning of the cycle.
<< Previous: Section C (Diagrams: Illustrated) | Return to main table of contents | Return to top of page | Next: Section E (Graphs) >>