Previous Page | Next Page | Table of Contents | Diagram Center Home
Click or select image to zoom
This is a page from a secondary education assessment. The full page where it appears can be seen below.
Click or select image to zoom
Challenges of Assessments
Making images accessible for assessments, especially formal assessments such as those used on standardized tests, can be more complex than making images accessible for books and require additional considerations. Making images accessible for formal assessments is beyond the scope of this sample book, but it is important to understand the range of issues. While educators may freely adapt textbook images to make them accessible for students who need them, they must seek permission from the company producing the assessment. In addition, changing a standardized assessment image in any way may affect the scope of what is being tested.
There are many less formal kinds of assessments such as in-class or end-of-chapter tests and quizzes that are included in textbooks, workbooks, and teacher’s guides. The choice of modality varies depending on factors such as the information to be conveyed, grade level, student knowledge and experience, and the image itself. It is also important to consider the content of the expected answer. An image description must provide enough information without giving away the answer.
Making This Image Accessible
This image can be made accessible with an image description or by using a tactile graphic. How this image description is displayed depends on the reading tool being used. In most mainstream reading tools, the description will not be displayed at all, but in tools designed for accessibility (or mainstream tools with accessibility features enabled), the description could be displayed below the image, voiced as part of the content, or both.
Text or Audio Description
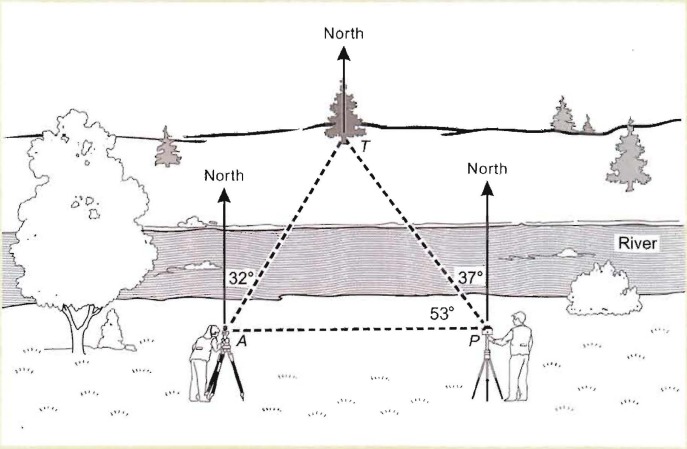
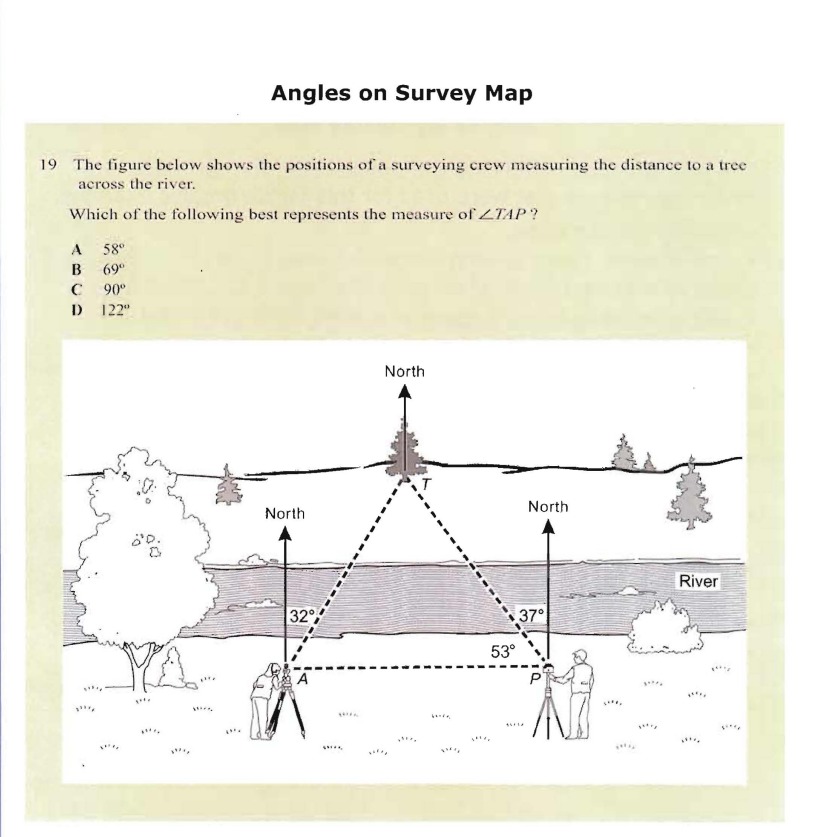
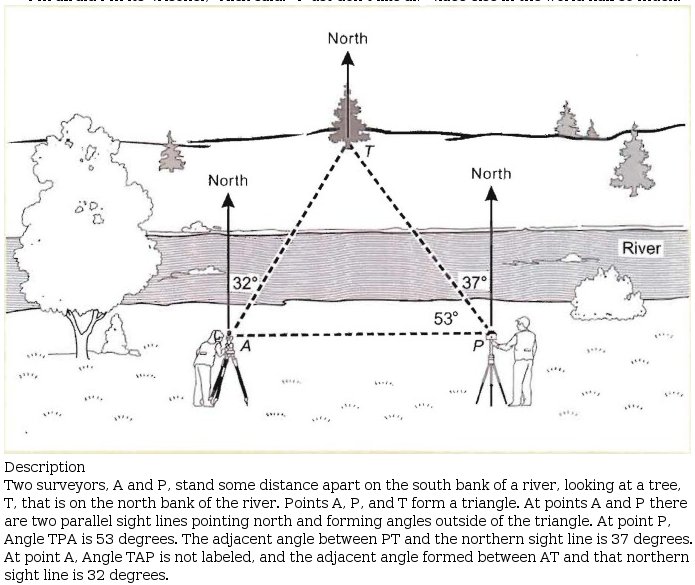
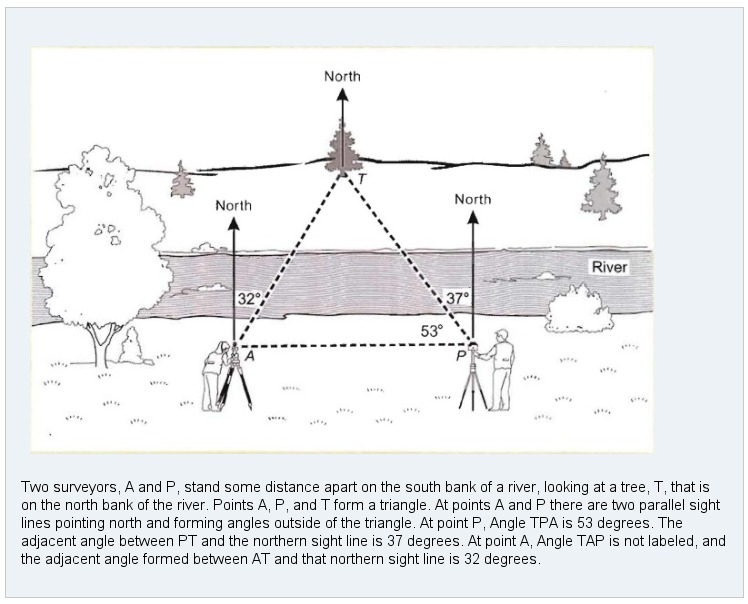
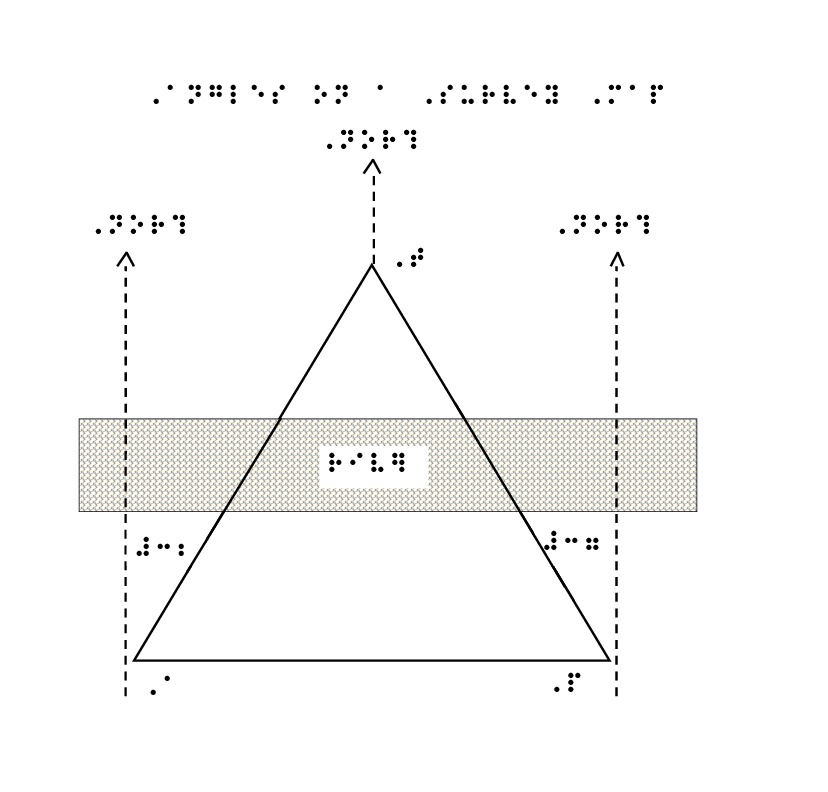
Two surveyors, A and P, stand some distance apart on the south bank of a river, looking at a tree, T, that is on the north bank of the river. Points A, P, and T form a triangle. At points A and P, there are two parallel sight lines pointing north and forming angles outside of the triangle. At point P, angle TPA is 53 degrees. The adjacent angle between PT and the northern sight line is 37 degrees. At point A, angle TAP is not labeled, and the adjacent angle formed between AT and that northern sight line is 32 degrees.
EPUB 3
Click or select image to zoom
The image above shows how the image description would look when implemented in an EPUB 3 file. The code used to create it is:
<figure>
    <div><img id="fig-04" src="images/survey.jpg" alt="survey map with angles"/></div><a epub:type="noteref" role="doc-noteref" href="#survey-desc">Description</a>
</figure>
...
The below detailed description can be placed anywhere in this document. It is not recommended to visibly hide this description making it only available to certain assistive technologies as others who do not use those technologies will not have access to this information.
...
<aside id="survey-desc" epub:type="footnote" role="doc-footnote" id="soc-desc">
        <p><a epub:type="backlink" role="doc-backlink" href="#fig-04">Figure 4.</a></p>

        <p>Two surveyors, A and P, stand some distance apart on the south bank of a river, looking at a tree, T, that is on the north bank of the river. Points A, P, and T form a triangle. At points A and P, there are two parallel sight lines pointing north and forming angles outside of the triangle. At point P, angle TPA is 53 degrees. The adjacent angle between PT and the northern sight line is 37 degrees. At point A, angle TAP is not labeled, and the adjacent angle formed between AT and that northern sight line is 32 degrees.</p>
 </aside>
DAISY
Click or select image to zoom
The image above shows how the image description would look when implemented in a DAISY file. The code used to create it is:
<imggroup>
    <p><img id="angles1" src="images/survey.jpg" alt="survey map with angles" /></p>
    <prodnote id="prodnote_000001">
        <p smilref="survey.smil#p_000001">Two surveyors, A and P, stand some distance apart on the south bank of a river, looking at a tree, T, that is on the north bank of the river. Points A, P, and T form a triangle. At points A and P, there are two parallel sight lines pointing north and forming angles outside of the triangle. At point P, angle TPA is 53 degrees. The adjacent angle between PT and the northern sight line is 37 degrees. At point A, angle TAP is not labeled, and the adjacent angle formed between AT and that northern sight line is 32 degrees.</p>
    </prodnote>
</imggroup>
Tactile Graphic
A tactile graphic allows the image to be interpreted manually. This graphic was developed for a high resolution graphics embosser.
Click or select image to zoom
Previous Page | Next Page | Table of Contents | Diagram Center Home