Previous Page | Next Page | Table of Contents | Diagram Center Home
Radial/Web Diagrams
© Pearson Education 2009
Click or select image to zoom
Making This Image Accessible
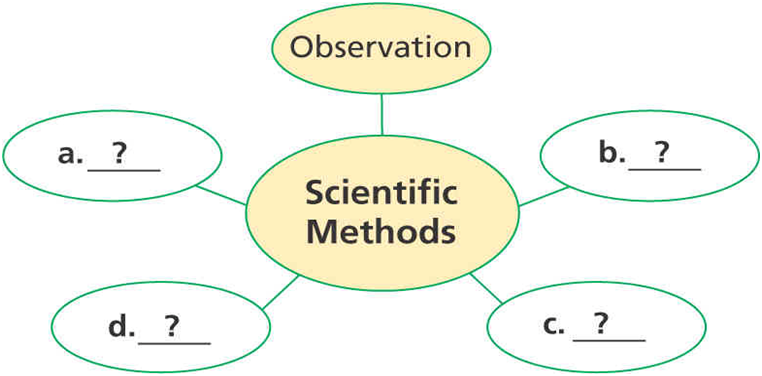
This image can be made accessible with an image description. Radial and Web diagrams are often used to show relationships between concepts and ideas. Simple radial diagrams like the one shown above, can be described in a few sentences. Complex radial diagrams require converting information into an outline.
Text or Audio Description
How to describe this image:
- Identify that it is a web diagram with a center circle, and state the number of circles connected or linked to it.
- Identify labels in the circles.
- Briefly describe the visual appearance of the diagram.
- Details such as the location of the circles (as if on a clock face) are not important.
Description
A web diagram has a center circle and five smaller circles connected to it. The center circle is labeled Scientific Methods. One connected circle is labeled Observation. The other four circles are labeled A, B, C, and D.
Hierarchy/Tree Diagrams
© Pearson Education 2009
Click or select image to zoom
Making This Image Accessible
This image can be made accessible with an image description. Hierarchy and Tree diagrams are often used to show relationships between types of activities, ideas, or responsibilities, such as roles in an organization. These diagrams can be all text or a combination of text and illustrations. Since the layers of these diagrams can become complex, it is important to know the purpose of the diagram and the intended audience. For this reason, three different descriptions for three different audiences are provided for this diagram.
Text or Audio Description
How to describe this image:
- Set up the diagram by providing the title if there is one and a general overview, including its levels and parts.
- Approach the diagram from top to bottom and from left to right.
- Any art or photos included in the diagram should be described if they are the only example of the concepts described in the diagram. For this particular image, the photos are labeled with the names of each level, so there is no need for additional description of the photos.
Depending on the grade level, the diagram can be described using a narrative, a simple bulleted list, or a complex nested list.
Description 1 uses all text. This should be the default approach, especially for lower grade levels.
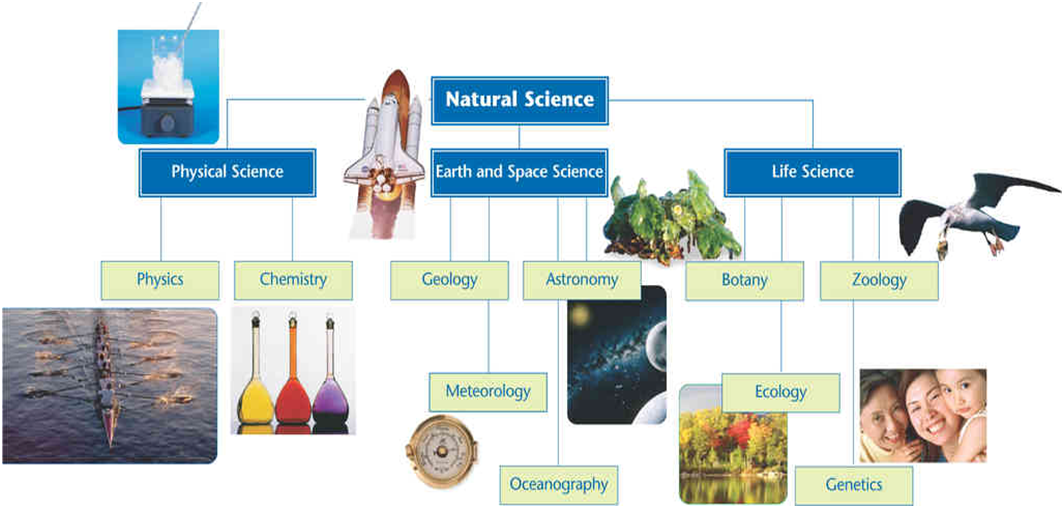
A tree diagram shows different branches of science. There are three levels, from top to bottom. The highest level is Natural Science. The next level has Physical Science, Earth and Space Science, and Life Science. Physical Science includes Physics and Chemistry. Earth and Space Science includes Geology, Meteorology, Astronomy, and Oceanography. Life Science includes Botany, Ecology, Zoology, and Genetics.
Description 2 uses a simple bulleted list. This approach is appropriate for high school grade levels, where students are comfortable navigating bulleted lists with a screen reader.
A tree diagram shows different branches of science. There are three levels, from top to bottom. The highest level is Natural Science. The next level has Physical Science, Earth and Space Science, and Life Science.
Physical Science
- Physics
- Chemistry
Earth and Space Science
- Geology
- Meteorology
- Astronomy
- Oceanography
Life Science
- Botany
- Ecology
- Zoology
- Genetics
Description 3 uses a nested list. This is the most complex approach and should only be used for academic, college-level, or professional texts.
A tree diagram shows different branches of science. There are three levels, from top to bottom.
- Natural Science.
- Physical Science.
- Physics and Chemistry.
- Earth and Space Science.
- Geology, Meteorology, Astronomy, and Oceanography.
- Life Science.
- Botany, Ecology, Zoology, and Genetics.
- Physical Science.
Previous Page | Next Page | Table of Contents | Diagram Center Home