<< Previous section: Tables | Main Table of Contents >>
Table of Contents for Section I
I. Text Only Images
Text Only Images
1. Nutrition Labels
© Pearson Education 2009
Guidelines:
- For images and artwork that contain text, the text needs to be described.
- Abbreviations should be spelled out to ensure that a screen reader will read the measurement correctly.
- Include punctuation to create small pauses so the information doesn’t run together.
- If the goal of the image is to convey a summary or brief overview, use a short description. See Description 1.
- If the goal of the image is to convey a general idea and specific data does not need to be identified from a long list of data, use a narrative approach. See Description 2.
- If the goal of the image is to convey specific data, use bullet points to break up information for easier navigability. See Description 3.
Description 1:
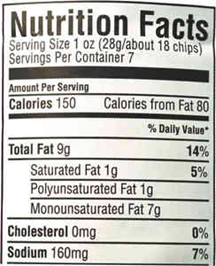
A nutrition label shows serving size in ounces and grams, calories, fat in grams and percent, and cholesterol and sodium in milligrams and percent.Description 2:
A nutrition label shows Nutrition Facts: Serving Size 1 ounce (28 grams/about 18 chips). Servings Per Container 7. Amount per Serving: Calories 150. Calories from Fat 80. Total Fat, 9 grams (14% daily value). Saturated Fat, 1 gram (5 % daily value). Polyunsaturated Fat, 1 gram. Monounsaturated Fat, 7grams. Cholesterol, 0 milligrams (0% daily value). Sodium, 160 milligrams (7% daily value).Description 3:
A nutrition label shows:- Nutrition Facts Serving Size 1 ounce (28 grams/about 18 chips).
- Servings Per Container 7.
- Amount per Serving: Calories 150. Calories from Fat 80.
- Total Fat, 9 grams (14% daily value).
- Saturated Fat, 1 gram (5% daily value).
- Polyunsaturated Fat, 1 gram.
- Monounsaturated Fat, 7grams.
- Cholesterol, 0 milligrams (0% daily value).
- Sodium, 160 milligrams (7% daily value).
This image in context:
- The caption below the image summarizes the goal of the image, which is to show students different units of measurement rather than to ask students to analyze specific data.
- The image is presented after the introduction of the topic converting one unit of measurement to another.
- In context, Description 1 works best.
Return to main table of contents | Return to top of page | Next
2. Timelines

© Harcourt School Publishers 2008
Guidelines:
- Set up the timeline by providing the title.
- Provide the most important pieces of the timeline, which are the dates and the events, in a specific order.
- Timelines should be described from left to right, in the order of earliest to most recent events.
- If there are more than three events, a bulleted list is useful.
- If there is a general trend, such as multiple events clustered around a certain timeframe or date, or a large gap in events, then a summary sentence could be useful before the list of the dates.
Description
A timeline shows three major events in Kentucky. About 12,000 years ago people arrive in Kentucky. About 3,000 years ago, native Kentuckians start growing corn and beans. About 1,000 years ago, Mississippians build mounds in Kentucky.This image in context:
- This figure is the opener for a lesson on Early People of Kentucky.
- The figure caption provides the same information as a description. Both capture all of the text in the timeline.
- Since there is no accompanying art along with the text, there is no additional information that needs to be described.
- In this context, the timeline is decorative.
Return to main table of contents | Return to top of page | Next (Conclusion)
Conclusion
Looking Ahead
In the coming months, Benetech plans to expand the Image Description Training Module, currently housed on the Poet website. Updates will incorporate the additional resources included in this reference guide, along with interactive exercises to facilitate learning, template-based authoring tools developed by key partners, and comments from accessibility experts. The DIAGRAM Center looks forward to integrating these resources and making them available to the broader community!<< Previous: Section H (Tables) |Return to top of page | Return to main table of contents >>