<< Previous section: Mathematics | Main Table of Contents | Next section: Text Only Images >>
Table of Contents for Section H: Tables
1. Simple
2. Complex
Tables
1. Simple
© NCAM 2009
Guidelines:
- Tables should be presented as properly marked-up HTML tables, providing independent access to the data.
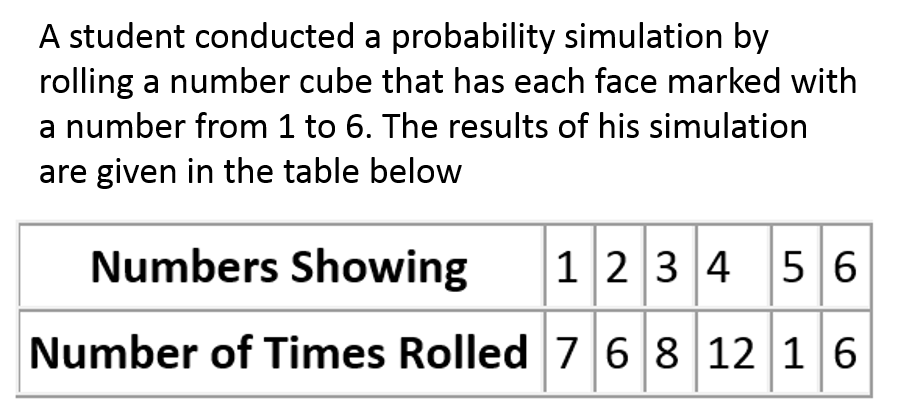
- In this case, the caption and the question are included in the description.
- Describing the table itself would be unnecessarily repetitive.
Description:
A student conducted a probability simulation by rolling a number cube that has each face marked with a number from 1 to 6. The results of his simulation are given in the table below:| Numbers Showing | 1 | 2 | 3 | 4 | 5 | 6 |
|---|---|---|---|---|---|---|
| Number of Times Rolled | 7 | 6 | 8 | 12 | 1 | 6 |
Complex
© Pearson Education 2009, Source: CDC/NCHS, National Vital Statistics System
Guidelines:
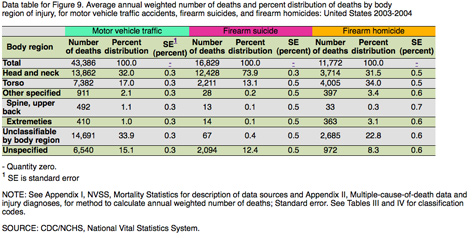
- While this table is complex with several layers of headings, it can be broken into three separate tables under the headings: Motor vehicle traffic, Firearm suicide and Firearm homicides.
- Providing three separate tables will aid in navigation and comprehension.
- The table includes two reference notations: a hyphen representing Quantity zero and a superscript one indicating that SE stands for standard error. To avoid confusion in the tables below, the superscript one and the hyphen were simply replaced with the words “Quantity zero” and “standard error.” This is an example of providing greater clarity as opposed to mimicking the exact visuals of the table.
- If desirable, this complex table may also be replicated exactly through proper HTML coding.
| Body region | Number of deaths | Percent distribution | Standard Error (percent) |
|---|---|---|---|
| Total | 43,386 | 100.0 | Quantity Zero |
| Head and neck | 13,862 | 32.0 | 0.3 |
| Torso | 7,382 | 17.0 | 0.3 |
| Other specified | 911 | 2.1 | 0.3 |
| Spine, upper back | 492 | 1.1 | 0.3 |
| Extremities | 410 | 1.0 | 0.3 |
| Unclassifiable by body region | 14,691 | 33.9 | 0.3 |
| Unspecified | 6,540 | 15.1 | 0.3 |
| Body region | Number of deaths | Percent distribution | Standard Error (percent) |
|---|---|---|---|
| Total | 16,829 | 100.0 | Quantity Zero |
| Head and neck | 12,428 | 73.9 | 0.3 |
| Torso | 2,211 | 13.1 | 0.5 |
| Other specified | 28 | 0.2 | 0.5 |
| Spine, upper back | 13 | 0.1 | 0.5 |
| Extremities | 14 | 0.1 | 0.5 |
| Unclassifiable by body region | 67 | 0.4 | 0.5 |
| Unspecified | 2,094 | 12.4 | 0.5 |
| Body region | Number of deaths | Percent distribution | Standard Error (percent) |
|---|---|---|---|
| Total | 11,772 | 100.0 | Quantity Zero |
| Head and neck | 3,714 | 31.5 | 0.5 |
| Torso | 4,005 | 34.0 | 0.5 |
| Other specified | 397 | 3.4 | 0.6 |
| Spine, upper back | 33 | 0.3 | 0.7 |
| Extremities | 363 | 3.1 | 0.6 |
| Unclassifiable by body region | 2,685 | 22.8 | 0.6 |
| Unspecified | 972 | 8.3 | 0.6 |
<< Previous: Section G (Mathematics) | Return to main table of contents | Return to top of page | Next: Section I (Text Only Images) >>