<< Previous section: Maps | Main Table of Contents | Next section: Tables >>
Table of Contents for Section G
G. Mathematics
Mathematics
1. Graphs
© Harcourt School Publishers 2008
Guidelines:
- State what type of graph is shown.
- Describe the x-and y-axes and what they represent.
- Write out the points in bullet form.
- Depending on how important the data points are to the central teaching point of the figure, the comma between the x- and y-coordinate may be written out as the word comma.
Description:
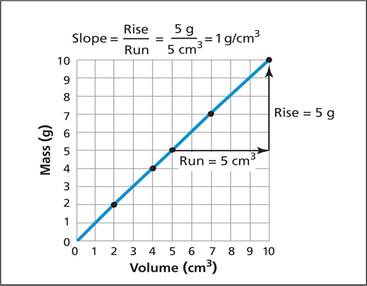
A line graph shows the x-axis is labeled Volume in cubic centimeters and goes from 0 to 10. The y-axis is labeled Mass in grams and goes from 0 to 10. A formula states that Slope equals Rise over Run, equals 5 grams over 5 cubic centimeters, equals 1 gram per cubic centimeters. There are 5 points plotted on the line, which rises steadily from left to right.- (2, 2).
- (4, 4).
- (5, 5).
- (7, 7).
- (10, 10).
This image in context:
- This image is shown at the beginning of the section.
- The surrounding text gives an overview and summary of the data.
Return to main table of contents | Return to top of page | Next
2. Math Diagrams

© Pearson Education 2009
Guidelines:
- Break the information into a bulleted list for easier navigation.
- Spell out abbreviated units for clearer audio pronunciation.
- Describe the parts of the image rather than explain the concept. That is done in the surrounding text.
Description:
Two diagrams show vectors on a number line.- Diagram A shows a number line that goes from 0, the start, to 6, the finish. A vector arrow goes from 0 to 4 and is labeled 4 kilometers. Another vector arrow goes from 4 to 6 in the same direction and is labeled 2 kilometers. The diagram represents the equation: 4 kilometers plus 2 kilometers equals 6 kilometers.
- Diagram B shows a number line that goes from 0, the start, to 4. In the middle of the number line, 2 is the finish. A vector arrow goes from 0 to 4 and is labeled 4 kilometers. Another vector arrow goes from 4 to 2 in the opposite direction and is labeled 2 kilometers. The diagram represents the equation: 4 kilometers minus 2 kilometers equals 2 kilometers.
This image in context:
- The diagram is used after the concept is introduced.
- Captions explain the concept very clearly.
Return to main table of contents | Return to top of page | Next
3. Geometry
© NCAM 2009
Guidelines:
- Traditional descriptions of math diagrams benefit from descriptions that are brief and specific.
- Organize the description in a linear fashion, in this case, moving left to right and use bullet points or line breaks to aid in navigation.
- Notice that the caption has already described how Greg is using the mirror to see the flagpole. The description, then, should focus on what is not included in the caption, i.e., the points and lines.
- Like any image, there are many effective ways to describe this math diagram and our survey participants made suggestions to add or change a word here or there. What they agreed upon was the use of short sentences that focused on the data.
Description:
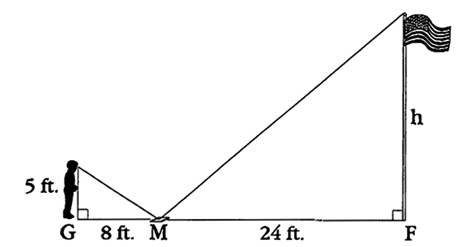
Greg’s feet are at point G. The mirror is 8 feet to his right at point M. The base of the flag pole is 24 feet to the right of point M and labeled point F. The distance from point G, Greg’s feet, to his eye is 5 feet. This is the vertical leg of a right triangle. The hypotenuse connects Greg’s eye to point M, the mirror on the ground. A similar triangle is formed from point M, the mirror, to point F, the base of the flag pole. The distance from point M to point F is 24 feet. The height of the flag pole is labeled H. This is the vertical leg of the second right triangle. The hypotenuse connects the top of the flagpole to point M, the mirror on the ground.Return to main table of contents | Return to top of page | Next
Equations and Expressions
For DTBs, the best solution is to render math in MathML and for the individual to use a reading system that provides a range of speech options. For all of the testing that can be done with blind and sighted experts and students, the solution to spoken mathematics comes down to offering a variety of styles that fit both the reading style of the individual and, in an educational setting, the pedagogy and learning style of the student. No single style or method of spoken math will cover every situation. Therefore, rendering the math in an unambiguous form, using MathML or (for some audiences) LaTeX, which can be then translated into speech in a variety of styles, should be the preferred practice.4a. Math rendered in MathML
Guidelines:
MathML is a standardized mark-up language that allows authors to provide unambiguous representations of mathematical expressions. MathML can be written by hand using a simple text editor or a special equation editor such as Design Science’s MathType, which translates mathematical notation into MathML. MathML does not provide a method for translating math to speech, however. Translating MathML into spoken English (or any other language) is the job of the MathML-reader or DTB-reader software. In the best of worlds, users will be able to decide how they want math communicated to them. In a simple example, some readers may want to hear math spoken in plain English; for example, “two X open parenthesis three Y plus four Z close parenthesis.” However, more experienced readers will desire shorthand in order to move through equations more quickly, reducing common expressions like “parenthesis” to “paren.” In an educational setting, another factor that must be considered is the pedagogical context in which the math is being presented. For example, a teacher may want a student to hear “X superscript two” as opposed to “X squared” in order to test comprehension of math notation. In the end, the choice of how best to convert MathML to spoken English will be affected by the user’s knowledge of the subject and his or her comfort with Nemeth code, LaTeX, or other math languages.Return to main table of contents | Return to top of page | Next
4b. Nemeth Code
Guidelines:
Nemeth code is an unambiguous language for translating math to Braille. Nemeth code has been in use for many years and is well appreciated by those who use it as the gold standard for representing math in Braille. gh’s MathSpeak renders MathML into spoken Nemeth code and provides many shortcuts for spoken mathematics. Indeed, MathSpeak enables the user to read math using several levels of verbosity, from having all words spoken in full to a rapid-fire shorthand. However, MathSpeak requires one to learn Nemeth code, in which even basic constructions, such as “begin-begin fraction,” can baffle the uninitiated.Return to main table of contents | Return to top of page | Next
4c. LaTex
Guidelines:
Math can also be rendered in LaTeX, an open-source typesetting program. Math in LaTeX is typically transmitted to a refreshable Braille display or translated into Braille via translation software such as Duxbury. Some people do read raw LaTeX; however, this seems to be limited to mathematicians and other STEM professionals.Return to main table of contents | Return to top of page | Next
4d. Spoken Math
Guidelines:
When MathML is not used and equations must be read aloud, it is best for the reader to be a subject expert who can read the math in a clear, unambiguous manner. One widely used resource is “Larry’s Speakeasy, Handbook for Spoken Mathematics.” Similar to Nemeth code, Larry’s Speakeasy provides a system for reading math in a non-ambiguous manner. While it is a good guide, it is not comprehensive. View other math resources.<< Previous: Section F (Maps) | Return to main table of contents | Return to top of page | Next: Section H (Tables) >>