Sonification
What is Sonification?
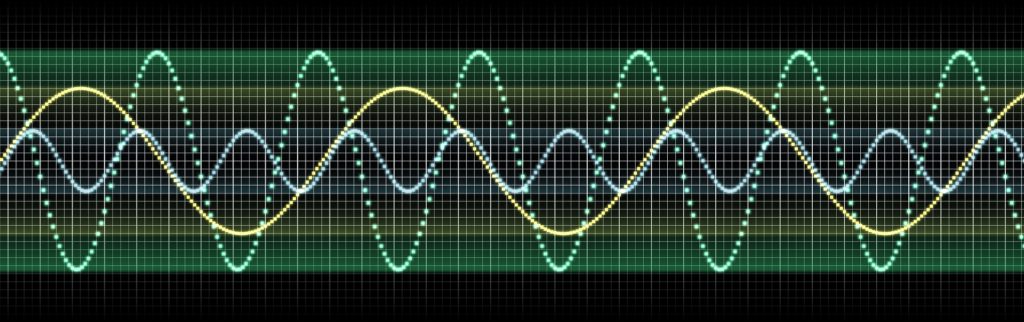
Sonification is the use of non-speech sound in an intentional, systematic way to represent information (Walker & Nees, 2011). It is often helpful to think of sonification as the creation of auditory “graphs.” In such cases, sonification involves representing changes in a set of values via changes in an acoustic parameter, such as representing changes in temperature by changes in the pitch of a sound. This representation is often referred to as a “mapping” (e.g., temperature is mapped onto pitch). While the present chapter will refer mostly to sonifications in the form of “auditory graphs,” it is important to note that sound can also be used systematically in many other ways, such as in STEM simulations, see the embedded simulation in the chapter on multimodal, (“PhET Interactive Simulations,” 2019; Tomlinson, Kaini, Harden, Walker, & Moore, 2019; Tomlinson, Kaini, Smith, Walker & Moore, (2019-under review), medical data monitoring (Sanderson, Penelope, Watson, Marcus, & Russell, 2005; Hinckfuss, Sanderson, Loeb, Liley, & Liu, 2016), weather monitoring (Schuett, Winton, Batterman, & Walker, 2014), and more. Everything discussed here also applies to those additional “flavors” of sonification.
When sound is used to represent data, the details matter, in several respects. First, some sound attributes are better than others for representing a given type of data. As an example, Walker (Walker, 2002) found that pitch was particularly good for representing temperature, whereas tempo was better for representing speed. Second, it matters whether an increase in the sound attribute (e.g., rising pitch) represents an increase or decrease in the data values (e.g., temperature). Walker found that an increase in pitch made most sense when it was used to represent an increase in temperature (a so-called positive polarity mapping). In contrast, it made more sense when an increase in pitch was used to represent a decrease in number of dollars (a negative polarity mapping). Third, it matters how much a given change in the sound dimension represents, in terms of a change in the data (a concept known as scaling). That is, if the pitch of a sound goes up by an octave (technically, a doubling of the sound’s frequency), does that signify a doubling of the temperature? Or more? Or less?
Indeed, other considerations for an effective sonification (Walker & Ness, 2011; Smith, & Walker, 2005) include how the axes, tick marks, and labels of an auditory graph are represented, and how the listener is able to interact with the information, making it play, pause, loop, replay, and so on. Thus, designing an effective sonification requires some knowledge and experience. However, it is not a very difficult task and can be a useful way to present data in an alternative format.
When all of these design issues are considered, the result can be an effective auditory display of data. The attached Figure 1 shows a visual graph that depicts a data series, but not much of the contextual information that would be helpful in understanding the data. Figure 2 shows the same data series, enhanced with helpful context such as tick marks and axis labels. Clearly, the second graph is more interpretable; we learn how to create such graphs through training at school.
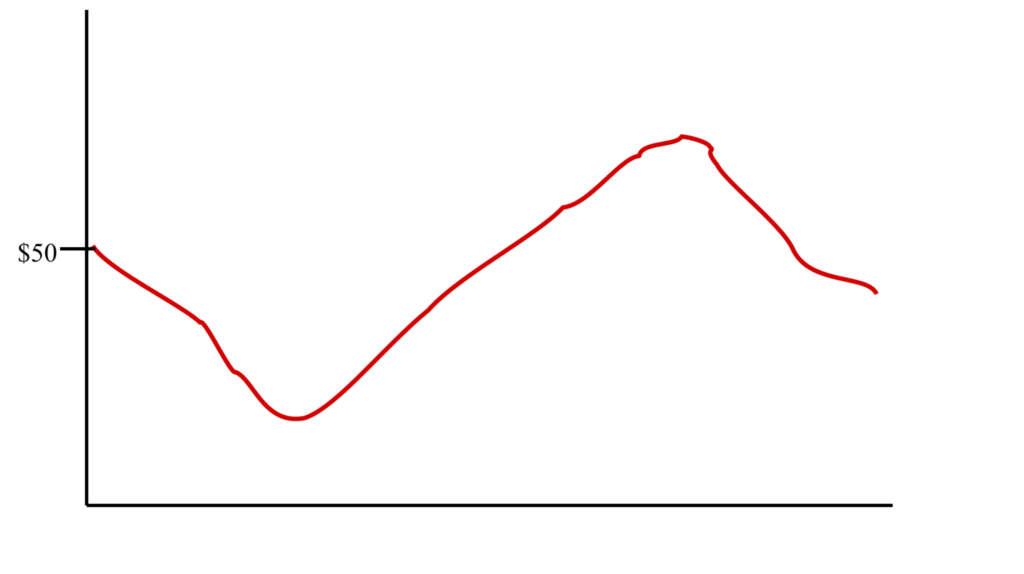
Sonification of Figure 1
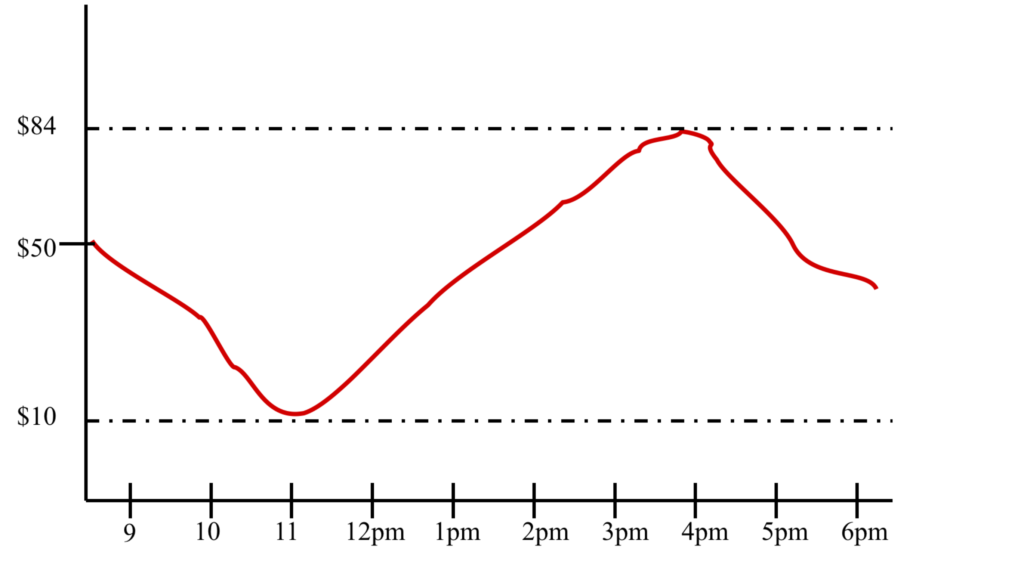
Sonification of Figure 2 (with x-axis content)
Sonification of Figure 2 (with y-axis content)
Sonification of Figure 2 (with both x-axis and y-axis content)
The attached audio files demonstrate a similar situation with auditory graphs. Audio 1 presents the sound of the data set that is shown in Figures 1 and 2, but devoid of any context; note the polarity, such that a decrease in the data series is played as a lower pitch in the audio. Also note that it is clearly impossible to derive much meaning from this over-simplified auditory graph. Audio 2 adds a click track to convey the x-axis or time context, and it is more interpretable. Audio 3 adds the y-context. Audio 4 includes both x-axis and y-axis context. Clearly, a successful graph (visual or auditory) requires careful design, following conventions and including enough contextual cues to support interpretation and meaning.
Why is it Helpful and Useful?
Displaying data via visual graphs is very common and used in all areas of society, especially in education and STEM contexts. However, for learners who cannot take full advantage of visual graphs, alternative formats, such as sound, can be crucial. Students with vision impairments are an obvious group of potential sonification users. But there are many others, including a wide variety of students who can see the visual graph, but may not process the information well in that format. For example, learners with dyslexia, autism, and other conditions may benefit from alternative modalities of presentation.
Typically, sonification and auditory graphs are used in conjunction with visual graphs, resulting in a coordinated multimodal data representation. In that way, learners can interact with the data in whichever modality they prefer. Further, in classrooms with a diversity of learners, groups of students can have shared educational experiences, via the multimodal graph, regardless of the modality used by any particular student. The equivalence of the data representation allows for a much more equitable learning environment. Another subtlety is that while a multimodal graph often combines audio with a static image of a graph, there can be other combinations. For example, in some cases, the visual representation is actually an animated video in which a cursor, line, or other highlight moves across the visual graph as the audio plays. This feature dynamically bonds what a person hears to what she sees. In addition, text descriptions of the graph can be generated manually or automatically, and these can be converted to audio via text-to-speech processing. Thus, the term multimodal can mean multiple modalities and multiple forms of representing the data. For more in-depth information on implications and uses of multimodal technology, please visit the dedicated multimodal chapter.
Who Does It?
Sonification and auditory graphs have been around for decades (Pollack & Ficks, 1954; Frysinger, 2005). Many different tools have been developed to create auditory and multimodal displays (Lodha, Beahan, Heppe, Joseph, & Zane-Ulman, 1997; Sonification Sandbox, 2009; Worrall, 2009; xSonify, 2018; Wolfram, 2019; AudiolyzR, 2013; Pauletto & Hunt, 2004), and a considerable body of research has led to guidelines for the creation of auditory graphs (Barrass, 1997; Hermann, Hunt, & Neuhoff, 2011). Lots of research has shown the utility of sonification and auditory graphs, and there is a solid base of evidence pointing to the potential effectiveness for sonification both in real-world science (e.g., even NASA researchers use sonification) (Patel, 2014; Hendrix, 2011), as well as in classrooms at all grade levels. Unfortunately, relatively few teachers are using sonification in the classroom. This is likely attributable to the relative newness of the technology and teachers and students being unaware of the benefits of sonification.
Some research projects have involved deploying sonification software tools in classrooms and evaluating the effectiveness of the tools (Mansur, Blattner, & Joy, 1985; Upson, 2001; Upson, 2002; Brown, Brewster, Ramloll, Yu, & Riedel 2002; Gardner, 2002; Van Scoy, McLaughlin, & Fullmer. 2005; Zucker, 2006; Davison, Walker, Bruce, Nees, Suh, Schuett, Mwaniki, Okeyo, & Mbari-Kirika, 2012; Chew, Davison, & Walker, 2014). In one early example, Upson deployed simple software tools to allow young math learners understand basic x-y plots (Upson, 2001; Upson, 2002). Walker has deployed an audio-enabled mathematics software toolkit (Chew, Tomlinson, & Walker, 2014; Davison, Suh, & Walker, 2012), and found that not only did the students find the tool effective and enjoyable, but also the in-class dynamics changed, so the teacher was able to spend more time working with the students in a one-on-one manner (Tomlinson, Batterman, Chew, Henry,& Walker, 2016; Chew, & Walker, 2013).
How Could it be Used in the Classroom?
Sonification and auditory graphs can be used as a complement for any static or animated visual graph of data. Thus, in classrooms, this means a vast range of opportunities. Generally, there are three main use cases, depending largely on who produces the sonification.
In the first use case, the producer or author of the sonification is the text book publisher or course materials developer. If a text book contains a visual graph, it could just as easily also include an audio file (or a more sophisticated way to access the audio-visual content) with the sonification. These sonifications would be produced by the author and/or publisher, and could be carefully designed and vetted to ensure they convey the intended educational message, and support the learning objectives. The sonifications could include the appropriate contextual cues that represent axes, tick marks, and labels, along with the data. Delivering audio and animated visual graphs is much easier with electronic delivery platforms. As printed text books give way to online and ePub formats, audio, video, and interactive elements are much more available and accessible
Of course, teachers would need to become proficient in using the multimodal data representations (see below for further discussion on that). However, teachers already need to be able to present and discuss the visual graphs (and other visual diagrams, etc.) that are included in the textbooks and other course materials, so this approach would be a matter of incremental training and some practice. The sonifications can be rolled into the lectures and learning activities just like the visual graphs.
In the second use case, the teacher is the content producer. In this situation, the teacher takes some data (perhaps collected by students in a science experiment), and creates a sonification, typically along with a visual graph. This process requires a software tool that would allow the teacher to interact with the data and then create the multimodal renderings as described in the chapter on multimodal. In addition to the software, the teacher would need some training in how to produce the sonification, including training on the mechanics of the process, as well as design aspects, such as how to pick effective mappings, polarities, and so on. Finally, the teacher would then need a way to deliver the resulting graph(s) to the students, perhaps via a cloud storage site or some other distribution mechanism. As discussed below, this does not seem to be a substantial hurdle, given that electronic files are already a big part of the modern learning ecosystem. Some tools are already available (Sonification Sandbox, 2009; Worrall, 2009; xSonify, 2018; Wolfram, 2019; Pauletto & Hunt, 2004), and multiple efforts are in progress to develop new software tools for the creation and distribution of multimodal graphs.
The third use case is when the student is the author. In most respects, this situation is the same as when the teacher is the content creator: software, training, and distribution/sharing/handing in the sonification are required. However, to the extent that the learner can become a content creator, this option should lead to much deeper understanding, according to theories of active learning (Bonwell & Eison, 1991; Freeman, et al., 2014; Olson & Riordan, 2012). Students are very good at picking up new tools and would likely embrace the multimodal learning approach, as long as they have the tools and scaffolding to bring their ideas to fruition. Collaborative learning with a more diverse array of fellow students would be encouraged, and it would be more workable given that there would be fewer impediments introduced by the representational formats. That is, for example, sighted and visually impaired students could work together more easily and have shared learning experiences if sonification is part of the mix. In a classroom, it is fairly straightforward (at least conceptually) for any of these approaches to work together. The underlying prerequisite is that the students can access the content and can be trained to interpret the multimodal graphs in order to further their learning goals.
Benefits to Learners
The inclusion of sonification and auditory graphs in the educational context has at least three substantial benefits. First, from the perspective of the learner, multimodal content can lead to a richer, more engaging, and more accessible experience. Students will have another dimension through which they can approach and understand what they are learning and another way to collaborate with their student peers in the pursuit of understanding.
Second, from the perspective of the educators, sonification and multimodal materials provide a dynamic dimension to the content. Because sounds are inherently dynamic and changing in time, they can more naturally convey changes in a data set or in a physical system that happen across time. For example, hearing a sonification of a heartbeat, and listening how it increases in tempo as the body exercises, is much more closely related to the actual physiology than a static visual chart or diagram would be. And third, at the larger societal level, anything that can increase equitable and engaged participation in education will lead to greater data literacy, expanded STEM proficiency, and a population of graduates that is more equipped to tackle the challenges of tomorrow.
Who Gets Left Out?
Sonification and auditory graphs have been presented, here, as largely expanding the educational opportunities for students. Multimodal data displays add to the access routes and expand the ways that learners can engage with data. However, embracing multimodal displays requires new technologies and training, and it further pushes education into a digital endeavor. As such, there is the risk of expanding the digital divide, in that those teachers and students who have access to digital educational tools could push ahead of their peers, much like access to computers (and connectivity) has led to a similar segregation of learners. Despite this possibility, the vastly improved accessibility and capacity to participate in learning lead me to a positive assessment. Sonification and auditory graphs are worth embracing.
Career Opportunities
It is absolutely reasonable, indeed expected, to consider the career potential for students (and others) who have experience with sonification and auditory or multimodal graphs. That’s part of any cost-benefit analysis of a new educational approach. In this case, at first glance, it seems like another chicken-and-egg situation: Graduates who have experience with sonification stand a better chance to get a job that involves sonification…but what jobs involve sonification? However, the more appropriate lens through which to assess this effort is: Does experience with graphs (of all kinds) and interpretation of data lead to better job prospects? The answer to that question is clearly “Yes!” The inclusion of sonification and auditory graphs in the learning environment is not about adding a new multimedia software tool to a student’s resumé. Rather, it is about making sure that a much broader range of students learns how to interact with, manipulate, represent, and interpret their own data. That is a crucial skill, not only in STEM careers, but in life in general. Whatever can be done to expand those skills will enhance careers (Freeman, et al. 2014; Olson & Riordan, 2012).
What is Needed to Enable Sonification and Auditory Graphs?
In order to use sonification in the classroom, several challenges need to be overcome. Starting from the largest (and most complex) challenge, these include the following. First, there needs to be acceptance on the part of teachers and schools (and eventually school boards and states, too) that sonification can increase access to data for many students and can enhance the experience of interacting with data for many other (and perhaps all) students. Many of the decision-making stakeholders will need convincing that something new is worth their time and effort. The requisite research is beginning to be available, but, unfortunately, there is a bit of a chicken-and-egg situation in that sonification needs to be deployed in order to gather evidence of educational effectiveness, but such deployment may depend on there already being such evidence.
Thus, there needs to be some funding for continued research and development in the field of sonification and auditory graphs, including ever-widening deployments. Typical sources of this kind of funding include federal agencies such as the Department of Education or the National Science Foundation.
Next, there needs to be easy-to-use and highly accessible software tools to transform data into sonifications and auditory graphs. These tools need to be accessible, flexible, functional, and multimodal, and they can generate a variety of representations from a variety of data types and sources. The tools need to be available to textbook producers, teachers, and learners. Training in producing sonifications, as well as interpreting them, will be crucial. The good news is that some tools are already available as previously mentioned. Very recently, new tools from SAS and Highcharts have begun to change the game even more. See the chapter on Data Visualization for further information on this expanding field.
Along with the tools to produce multimodal content, there needs to be a mechanism to handle the resulting files. This function includes editing, saving, sharing, re-editing, sending, and receiving the files. Nontrivial, technical aspects such as a common file format, watermarking, metadata, and access privileges need to be considered. And, of course, computer hardware, audio capabilities (e.g., speakers, headphones, or even bone conduction headphones (Chew & Walker, 2013)), storage, and bandwidth issues will need to be addressed.
Even though the list above may seem long, including sonification would not be starting from scratch; students are already using born digital electronic files in their classes (e.g., Google docs, multimedia PowerPoint presentations) and are often creating and submitting videos for class credit. Thus, many of the challenges discussed above are already being figured out, albeit in a largely ad hoc manner, in the current educational settings.
Above all else, training will be critical throughout the entire deployment and adoption process. Ensuring that all stakeholders have the technical, design, and pedagogical training will make all of the investment in sonification software and hardware bear fruit.
One final challenge that needs to be mentioned is that whatever is used to teach and learn in the classroom, in assignments, and in homework, must also be available for use on assessments (quizzes, exams). This area includes formal tests administered by school, state, and other entities (e.g., the College Board and Educational Testing Service (ETS)). It is entirely unclear, at this point, whether this requirement would prove to be one of the toughest hurdles to overcome, or, perhaps, one of the easiest (e.g., if ETS decided to include multimodal content on a standardized test).
Actions Parents and Teachers Can Take
Parents can improve the educational opportunities for their children in many ways. In the context of sonification and multimodal data representations, here are three specific actions. First, become engaged and knowledgeable about the electronic tools, resources, and deliverables that are part of the classrooms of today. Many of us do not have a solid understanding of how math, science, literature, history-indeed every subject-is now taught through technology. Google docs, PowerPoint slide decks, online learning portals, digitally-administered standardized tests – children’s school experience is much different today. Assessing these tools with a critical eye is part of the process. Ask yourself and your young learner about the effectiveness, usability, and accessibility of the online tools. Ask yourself and the teachers what has been gained and what has been lost in this digital transformation. What are the untapped potentials for digital tools? Ask how audio is being used, and you will quickly agree that sound is under-utilized. The prevalent “beeps” and “bops” do not come close to reaching the potential for serious sonification and intentional auditory displays.
Second, help make a universally accessible, multimodal learning experience the norm, not the exception. Push for computers in the classroom, and insist that they have software for multimodal consumption and authoring, with plenty of headphones and speakers available. Even when a classroom is equipped with a few computers, often there are either no headphones or not enough to handle the inevitable breakage of a set here or there over the school year. Encourage teachers to use sound, and encourage them to require their students to do so as well, but in a systematic, learning-supportive manner. Just sticking a random sound clip into a PowerPoint slide is not going to help learning. Principled, pedagogically-grounded multimodal learning is the goal that will enhance learning for all students.
Third, encourage higher-level decision makers to embrace both research and deployment of sonification and multimodal educational tools. This effort may be at the local level, when a school is considering technology upgrades for the classroom; when a school board is deciding on budget priorities; or at the federal level when funding decisions are made in relation to research support. Not all parents can be, or choose to be, active at those larger scales, but however you choose to engage, push for the future-looking, inclusive, accessible, and science-supporting education tools, such as sonification, that will lead learners forward.
References
- Andrew A. Zucker. 2006. Development and testing of math insight software. J. Educ. Technol. Syst. 34, 4 (2006), 371–386.
- AudiolyzR. https://cran.r-project.org/web/packages/audiolyzR/index.html Retrieved 2019-05-17.
- Barrass, S. (1997). Auditory information design. PhD Dissertation. Australian National University. http://hdl.handle.net/1885/46072
- Bonwell, Charles; Eison, James (1991). Active Learning: Creating Excitement in the Classroom (PDF). Information Analyses – ERIC Clearinghouse Products (071). p. 3. ISBN 978-1-878380-08-1. ISSN 0884-0040
- Chew, Y. C., & Walker, B. N. (2013). What did you say?: Visually impaired students using bonephones in math class. Proceedings of the 15th International ACM SIGACCESS Conference on Computers and Accessibility (ASSETS2013), Bellevue, WA (21-23 October, 2013). Article No. 78. DOI: http://dx.doi.org/10.1145/2513383.2513393
- Chew, Y. C., Tomlinson, B. J., Walker, B. N. (2014). Graph and Number line Input and Exploration (GNIE) Tool Technical Report. Georgia Institute of Technology School of Psychology Technical Report. May 29, 2014. http://hdl.handle.net/1853/51943
- Chew, Y. C., Davison, B., & Walker, B. N. (2014). From Design to Deployment: An Auditory Graphing Software for Math Education. Proceedings of the 29th Annual International Technology & Persons With Disabilities Conference (CSUN2014), San Diego (17-22 March).
- Davison, B. K., Suh, H., & Walker, B. N. (2012). Math GNIE: Visually impaired students creating graphs and number lines on a computer. Proceedings of the AER2012 Conference. Bellevue, WA (18-22 July).
- Davison, B. K., Walker, B. N., Bruce, C. M., Nees, M. A., Suh, H., Schuett, J., Mwaniki, R., Okeyo, P., & Mbari-Kirika, I. (2012). Accessible graphs in Kenyan STEM education. Proceedings of the 27th Annual International Technology & Persons With Disabilities Conference (CSUN2012), San Diego (27 February -03 March).
- Douglass L. Mansur, Merra M. Blattner, and Kenneth I. Joy. 1985. Sound graphs: A numerical data analysis method for the blind. J. Med. Syst. 9, 3 (1985), pp.163-174.
- Frances Van Scoy, Don McLaughlin, and Angela Fullmer. 2005. Auditory augmentation of haptic graphs: Developing a graphic tool for teaching precalculus skill to blind students. In Proceedings of the 11th International Conference on Auditory Display (ICAD’05).
- Freeman, S. et al. (2014). Active learning increases student performance in science, engineering, and mathematics. Proceedings of the National Academy of Scientists, 111(23), 8410-8415. DOI: https://dx.doi.org/10.1073/pnas.1319030111
- Frysinger, S. P. (2005). A brief history of auditory data representation to the 1980s. Proceedings of the Eleventh Meeting of the International Conference on Auditory Display (ICAD2005). Limerick, Ireland, July 6-9, 2005. 410-413. http://hdl.handle.net/1853/50089
- Hendrix, 2011. NASA Scientist Wanda Diaz-Merced: https//www.nasa.gov/centers/goddard/about/people/Wanda_Diaz-Merced.html Retrieved 2019-07-11.
- Hermann, T., Hunt, A., & Neuhoff, J.G. (2011). The Sonification Handbook. Logos Publishing House, Berlin. 1. edition (11/2011) ISBN 978-3-8325-2819-5
- Hinckfuss, Kelly; Sanderson, Penelope; Loeb, Robert G.; Liley, Helen G.; Liu, David (2016). “Novel Pulse Oximetry Sonifications for Neonatal Oxygen Saturation Monitoring”. Human Factors. 58 (2): 344-359. DOI: http://dx.doi.org/10.1177/0018720815617406. PMID 26715687.
- John A. Gardner, Access by Blind Students and Professionals to Mainstream Math and Science, Proceedings of the 8th International Conference on Computers Helping People with Special Needs, p.502-507, July 15-20, 2002.
- Lodha S. K., Beahan J., Heppe T., Joseph A., Zane-Ulman B., MUSE: a musical data sonification toolkit, Proceedings of the 4th International Conference on Auditory Display (ICAD1997), Palo Alto, California, November 2-5, 1997. pp. 1119-1134. http://hdl.handle.net/1853/50750
- Lorna Brown, Stephen Brewster, Ramesh Ramloll, Wai Yu, and Beate Riedel. 2002. Browsing modes for exploring sonified line graphs. In Proceedings of British Human-Computer Interaction Conference. pp. 6-9.
- Olson & Riordan, (2012). President’s Council of Advisors on Science and Technology. (2012). Engage to excel: Producing one million additional college graduates with degrees in science, technology, engineering, and mathematics. Retrieved from https://eric.ed.gov/?id=ED541511
- Patel, (2014). NASA Scientist Robert Alexander: https://www.nasa.gov/content/goddard/more-than-meets-the-eye-nasa-scientists-listen-to-data/ Retrieved 2019-07-11.
- PhET Interactive Simulations. 2019. Resistance in a Wire. Retrieved May 1, 2019 from https://phet.colorado.edu/en/simulation/resistance-in-a-wire
- Pollack, I. & Ficks, L. (1954), “Information of elementary multidimensional auditory displays”, Journal of the Acoustical Society of America, 26: 136, DOI: http://dx.doi.org/10.1121/1.1917759
- Sanderson, Penelope M.; Watson, Marcus O.; Russell, John (2005). “Advanced Patient Monitoring Displays: Tools for Continuous Informing”. Anesthesia & Analgesia. 101 (1): 161-168. DOI: http://dx.doi.org/10.1213/01.ANE.0000154080.67496.AE. PMID 15976225.
- Sandra Pauletto and Andy Hunt, (2004). A Toolkit for Interactive Sonification. Proceedings of ICAD Tenth Meeting of the International Conference on Auditory Display, Sydney, Australia, July 6-9, 2004.
- Schuett, Jonathan H.; Winton, Riley J.; Batterman, Jared M.; Walker, Bruce N. (2014). Auditory Weather Reports: Demonstrating Listener Comprehension of Five Concurrent Variables. Proceedings of the 9th Audio Mostly: A Conference on Interaction with Sound. AM ’14. New York, NY, USA: ACM. pp. 17:1-17:7. DOI: http://dx.doi.org/10.1145/2636879.2636898. ISBN 9781450330329.
- Smith, D. R., & Walker, B. N. (2005). Effects of auditory context cues and training on performance of a point estimation sonification task. Applied Cognitive Psychology, 19(8), 1065-1087. DOI: http://dx.doi.org/10.1002/acp.1146
- Sonification Sandbox. http://sonify.psych.gatech.edu/research/sonification_sandbox/ Retrieved 2019-05-17.
- Tomlinson, B. J., Kaini, P., Harden, E. L., Walker, B. N., & Moore, E. B. (2019). Design and Evaluation of >a Multimodal Physics Simulation. Journal on Technology and Persons with Disabilities, vol. 7. pp. 88-102.
- Tomlinson, B.J., Kaini, P., Smith, T.L., Walker, B.N., Moore, E.B. (2019-under review) Auditory Display in Interactive Science Simulations: Description and Sonification Support Interaction and Enhance Opportunities for Learning. Proceedings of the 21st International ACM SIGACCESS Conference on Computers & Accessibility (ASSETS 2019), Pittsburgh, PA, USA (28-30 Oct).
- Tomlinson, B. J., Batterman, J., Chew, Y. C., Henry, A., & Walker, B. N. (2016). Exploring Auditory Graphing Software in the Classroom: The Effect of Auditory Graphs on the Classroom Environment. ACM
- Transactions on Accessible Computing (TACCESS), 9(1), 3. DOI: http://dx.doi.org/10.1145/2994606
- Upson, R. (2001). Sonifications as mathematics teaching tools. Proceedings of the 7th International Conference on Auditory Display (ICAD2001), Espoo, Finland, July-August. pp. 222-226.
- Upson, R. (2002). Educational sonification exercises: Pathways for mathematics and musical achievement. Proceedings of the 8th International Conference on Auditory Display (ICAD), Kyoto, Japan, July 2-5, 2002. p. 1-6. http://hdl.handle.net/1853/51358
- Walker, B. N., & Nees, M. A. (2011). Theory of Sonification. In T. Hermann, A. Hunt, & J. Neuhoff (Eds.), The Sonification Handbook (pp. 9-39). Berlin, Germany: Logos Publishing House. ISBN 978-3-8325-2819-5. http://sonification.de/handbook/download/TheSonificationHandbook-chapter2.pdf
- Walker, B. N. (2002). Magnitude estimation of conceptual data dimensions for use in sonification. Journal of Experimental Psychology: Applied, 8, 211-221. DOI: http://dx.doi.org/10.1037/1076-898X.8.4.211
- Wolfram sonification tools.https://reference.wolfram.com/language/guide/SoundAndSonification.html Retrieved 2019-05-17.
- Worrall, (2009). SoniPY.http://www.sonification.com.au/sonipy/index.html Retrieved 2019-05-17.
- xSonify. https://sourceforge.net/projects/xsonify/ Retrieved 2019-05-17.
Published: 2019-08-31